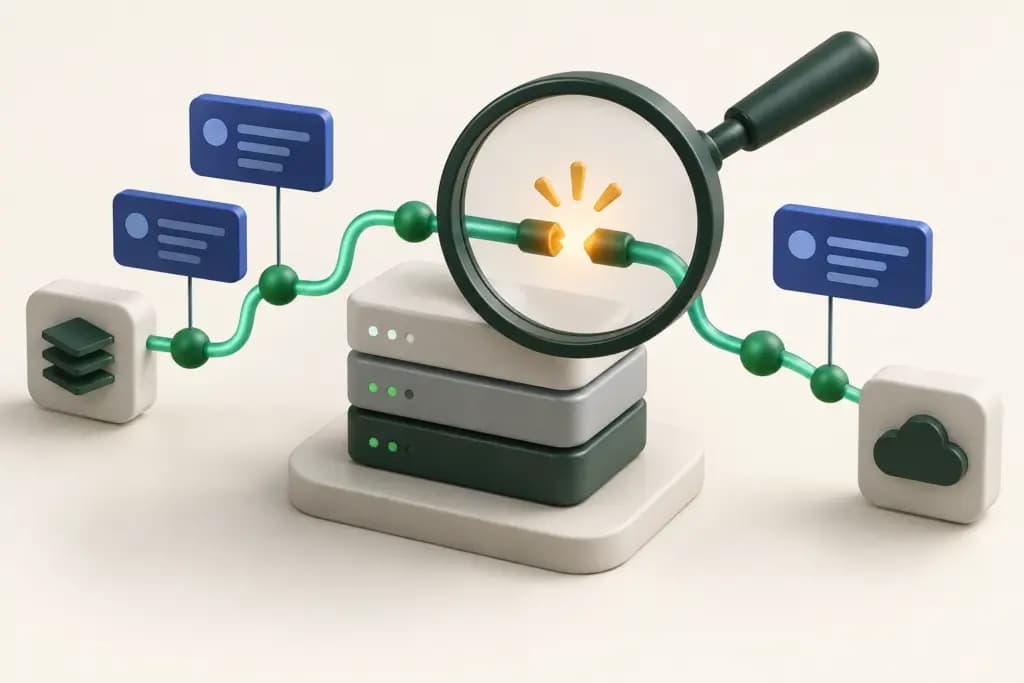
An exception alert should help a developer decide what broke, who is affected, and what to do next. If it only creates a noisy inbox, the team has acquired another operational burden. Error monitoring is valuable when it connects a failure to actionable code and release context.
Sentry, Bugsnag, Rollbar, Airbrake, and GlitchTip all address application errors, but their scope and operating models differ. Sentry connects exceptions to a broader diagnostics platform, Bugsnag emphasizes application stability, Rollbar organizes production occurrences, Airbrake provides focused error workflows, and GlitchTip offers a simpler open-source option. This assessment uses official sources checked October 12, 2026, without claiming comparative hands-on tests.
Error monitoring is a distinct job
An external monitor can tell you a page stopped responding; an application SDK can report the exception, stack trace, and context behind a failure. Our uptime monitoring comparison covers that complementary external check. Neither view alone explains every failure.
Separate an error occurrence from a grouped issue. One faulty loop can generate thousands of events that represent one defect. Grouping improves the inbox, but billing may still count individual occurrences. Your selection should include both diagnostic usefulness and the ability to control collection when a release becomes noisy.
The quick difference
| Product | Best fit | Useful emphasis | Boundary to examine |
|---|---|---|---|
| Sentry | Teams connecting errors with broader diagnostics | Code context, releases, and related telemetry | Separate data quotas and paid capabilities |
| Bugsnag | Teams managing release stability | Crash diagnostics and user-impact prioritization | Event packs, spans, and governance tiers |
| Rollbar | Production exception triage | Grouping, telemetry, and deployment tracking | Occurrences, replays, retention, and credits |
| Airbrake | Focused error workflows for application teams | Notifiers, diagnostic context, and alerts | Usage caps and separately metered performance |
| GlitchTip | Teams wanting simpler hosted or self-run monitoring | Open source and Sentry SDK compatibility | Shared event budget and self-hosting responsibilities |
Sentry
Sentry reports errors with stack traces, breadcrumbs, release context, and user-impact information. Its broader platform also includes tracing, replay, logs, and other diagnostics. That breadth can help when a defect crosses client and server boundaries and an exception alone does not explain the sequence.
Strengths: code-level context gives developers a more direct starting point than a generic alert. Release health can connect a problem with version adoption and stability. The value depends on uploading usable debug information and consistently identifying releases, rather than just adding an SDK and accepting every default.
Limitations: telemetry categories have separate quotas. More tracing or replay is not automatically covered by an error allowance, and AI debugging has additional commercial conditions. The Developer tier is limited to one user. Paid tiers, spending thresholds, filters, and retention should be reviewed together.
Best fit: teams wanting a connected diagnostic workflow and willing to manage collection deliberately. Demonstrate a minified frontend exception, its associated backend activity, and an alert that reaches the correct owner. Verify what remains visible after an event budget is exhausted.
Bugsnag
Bugsnag captures handled and unhandled errors across application platforms. Its materials describe stack traces, breadcrumbs, release tracking, and stability analysis. Rather than treating every failure as equal, its workflows help teams inspect affected users and the health of a release.
Strengths: stability-oriented analysis is useful when deciding whether to continue a rollout or prioritize a crash fix. Diagnostic details and mapping-file support help translate an opaque crash into a specific engineering task. Custom metadata can provide relevant context, provided your team avoids collecting unnecessary personal information.
Limitations: error events and performance spans are distinct purchasing units. The free tier currently includes one user, 7,500 events, and one million spans per month, with shorter retention. Higher plans add prioritization and organizational controls; on-premises deployment is an Enterprise arrangement. A dynamic price selector is not a reliable fixed quote.
Best fit: teams with release stability as a central operational question, including mobile applications. During evaluation, compare two application versions and ask whether the dashboard supports the actual rollout decision. Confirm event scaling and governance in the purchased tier.
Rollbar
Rollbar collects exceptions through SDKs for server, client, and mobile applications. Its current plans describe intelligent grouping, stack traces, telemetry, and deployment tracking. Those features aim to turn many raw occurrences into a manageable set of issues with enough context for triage.
Strengths: a focused production error feed can fit teams that already have separate infrastructure monitoring. Deployment tracking supplies an important clue when errors appear immediately after a release. Grouping can reduce repeated manual sorting, although teams should inspect whether distinct causes remain distinguishable.
Limitations: the commercial model distinguishes occurrences, replays, and credits. Retention and advanced controls vary by plan. The Free tier currently lists 5,000 occurrences and 1,000 replay sessions; paid pricing depends on configured volume. Unlimited projects or users does not mean unlimited diagnostic data.
Best fit: teams prioritizing exception triage inside an established development workflow. Send several deliberately different failures in a nonproduction pilot and review how they group. Include a regression and verify that the alert behavior matches your definition of a reopened incident.
Airbrake
Airbrake uses language and framework notifiers to report application errors. Its product page describes diagnostic details, deployment context, and JavaScript breadcrumbs that help reconstruct the events preceding a failure. It is relevant when the team wants a direct route from an exception to investigation.
Strengths: focused error reporting can be easier to introduce than an extensive observability program. Capturing useful context and connecting notifications to the development workflow may be enough for a smaller application’s immediate needs. That is a workflow assessment, not a claim of lower runtime overhead.
Limitations: error and performance monitoring are separately metered products. Usage caps can prevent additional collection, which controls cost while also reducing visibility. The pricing page combines plan cards with older-looking tier language and several calculator values; obtain a configuration-specific quote rather than combine those figures into an invented total.
Best fit: application teams wanting a focused error service with explicit cost controls. Confirm the notifier for your framework, diagnostic fields, retention, and alert routing. Ask what happens to incoming errors once the configured usage cap is reached.
GlitchTip
GlitchTip combines error tracking, basic performance monitoring, and uptime checks. It is open source and compatible with Sentry client SDKs, with hosted and self-hosted options. This makes it a relevant alternative for teams that want straightforward issue monitoring without purchasing every part of a broader diagnostic platform.
Strengths: deployment choice provides a practical way to retain infrastructure control. SDK compatibility can simplify initial integration for supported applications. A comparatively narrow interface may suit a team whose core need is finding and resolving exceptions rather than building complex telemetry dashboards.
Limitations: compatibility does not establish complete feature parity with Sentry. Hosted events count across errors, uptime checks, performance transactions, and release-file storage. The free allowance is currently 1,000 events monthly, and excess usage introduces progressive throttling. Self-hosting transfers capacity, upgrades, availability, and recovery work to your team.
Best fit: teams comfortable with a simpler workflow or operating their own service. Test the exact SDK features you need and model all event types together. Confirm the selected hosting region and support arrangement rather than assuming every deployment has identical terms.
How to evaluate error monitoring
Use representative failures. Include a handled business error, an uncaught backend exception, a minified frontend failure, and a crash after a deployment. Each should contain enough approved context to investigate without exposing credentials or unrelated user data. The exercise should assess diagnosability, not merely whether an event appears.
Verify release artifacts. Source maps and symbol files must correspond to the actual deployed build. Have someone unfamiliar with the application follow the stack trace to a useful location. If the result is unreadable, the missing work may be in your build pipeline rather than in the monitoring interface.
Model a bad day. Estimate normal traffic and an error burst. Record which unit is billed, whether repeated occurrences count, how overages work, and what filters or caps discard. A low base price can conceal the cost of an unbounded failure loop. A hard cap can conceal continuing damage if the team assumes silence means recovery.
Design ownership and privacy. Decide who receives a new issue, a regression, and a widespread spike. Scrub sensitive fields before transmission where possible. Review access, retention, and deletion requirements against the actual plan and hosting arrangement. More collected context is useful only when it is appropriate to retain.
Compare complete costs. Separate subscription fees, data volumes, replay, AI features, support, and self-hosted infrastructure. Confirm currency, taxes, billing cycle, annual commitment, and renewal terms. Where a selector omits a price, preserve that uncertainty until a written estimate resolves it.
Evaluation checklist
- Are traces readable for your deployed builds and frameworks?
- Can grouping distinguish different defects and identify regressions?
- Do alerts reach a named owner with an actionable next step?
- Are collection, retention, and burst costs explicitly bounded?
- Can you explain what monitoring stops collecting at its limit?
Conclusion
Sentry suits connected application diagnostics, Bugsnag merits attention for release stability, and Rollbar fits focused production exception triage. Airbrake offers a direct error workflow, while GlitchTip provides a simpler open-source deployment choice. Select against readable evidence, ownership, and collection controls, then price the failure volume your application could actually generate.
References
Official materials checked October 12, 2026.